
Technical Analysis of the Share Market: How Traders Read Price Trends and Market Behavior
What Is Technical Analysis of the Share Market and Why Is It Used?
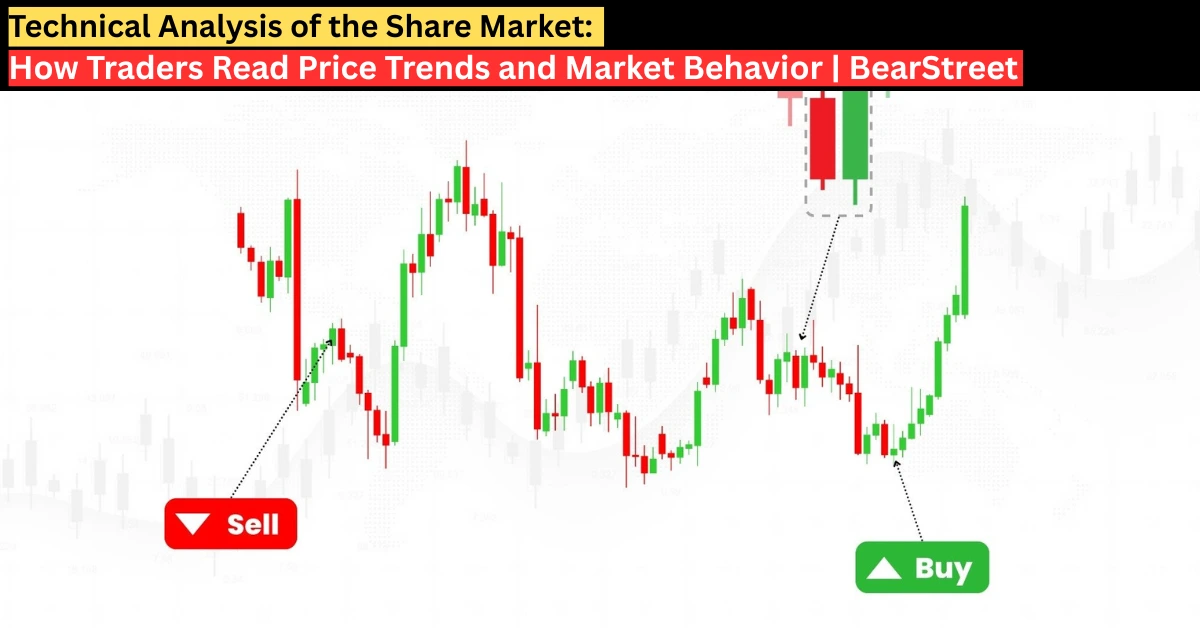
Technical analysis of the share market is a method of studying price movement and trading volume to understand how markets behave under different conditions. It focuses on interpreting historical data to identify trends, momentum shifts, and areas where price has previously reacted. The purpose is not to predict markets with certainty, but to develop a structured framework for observing market behavior.
This approach is widely applied in professional trading environments because it is based on observable data rather than assumptions or opinions. By analyzing charts, traders attempt to understand how demand and supply influence price movement over time.
How Does Technical Analysis in Trading Reflect Market Psychology?
Every price movement represents decisions made by buyers and sellers. Fear, optimism, uncertainty, and profit-taking all leave visible traces on price charts. Technical analysis in trading interprets these traces to understand crowd behavior.
For example, strong upward trends often reflect sustained buying interest, while repeated price rejections at resistance levels suggest selling pressure. Recognizing these behavioral patterns allows traders to better understand market sentiment and structure.
Why Is Trend Identification Central to Share Market Technical Analysis?
Trends provide the broader context of market movement. An upward trend shows increasing demand, while a downward trend signals persistent selling pressure. Periods of sideways movement indicate balance between buyers and sellers.
Share market technical analysis emphasizes aligning trading decisions with prevailing trends rather than trading against them. This principle helps traders manage risk more effectively and avoid low-probability situations.
Which Tools Are Commonly Applied in Technical Trading Analysis?
Traders use a combination of chart-based tools and indicators to observe market conditions. These tools help measure trend strength, momentum, volatility, and participation levels.
| Tool | Market Insight | Purpose in Analysis |
| Moving Averages | Trend direction | Market structure |
| RSI Indicator | Momentum strength | Identifying shifts |
| MACD | Trend momentum | Change confirmation |
| Bollinger Bands | Volatility | Price expansion |
| Volume Analysis | Participation | Move strength |
These tools support analysis rather than replace disciplined observation of price movement.
How Does Technical Analysis of Stocks Support Risk Management?
Risk management is a central element of professional trading. Technical analysis of stocks helps identify price levels where market behavior may change. These levels are often used to define exit points when trade ideas are no longer valid.
By planning trades around market structure rather than emotion, traders can control potential losses more effectively. This structured approach promotes consistency and long-term sustainability.
Where Can Technical Analysis in the Stock Market Be Applied?
Although often associated with equities, technical analysis in the stock market is also widely used in foreign exchange, commodities, indices, and other financial instruments. Since the method focuses on price behavior, its principles remain applicable across markets.
What Are Common Challenges Without Structured Trading Analysis?
Without a clear analytical framework, traders may react emotionally to market fluctuations or rely on unverified information. This often leads to inconsistent decisions, late entries, and poorly managed risk.
Trading technical analysis introduces discipline by encouraging observation, planning, and review — key elements of professional market participation.
Why Does Technical Analysis of the Share Market Remain Relevant Today?
Despite technological advancements and increased market speed, the psychological forces driving market behavior remain largely unchanged. Human reactions to risk and opportunity continue to shape price movement.
Because technical analysis of the share market is rooted in these behavioral patterns, it remains a widely used framework for understanding market structure and momentum.
For traders who already participate in the markets and want to refine their technical analysis of the share market through structured research, disciplined chart evaluation, and real-time market observation, BearStreet provides professional trading insights and analytical frameworks focused on market structure and risk awareness.
Technical Analysis of the Share Market – Common Search FAQs
1. What is technical analysis of the share market in simple words?
Technical analysis is the study of price charts and past market data to understand trends, momentum, and how buyers and sellers behave in the market.
2. Does technical analysis really work in trading?
Technical analysis does not guarantee outcomes, but it helps traders assess probability by observing historical price behavior and market structure.
3. Which technical indicator is best for beginners?
Moving averages and RSI are commonly used by beginners because they are simple and help identify trends and momentum clearly.
4. Can technical analysis be used for long-term investing?
Yes, many investors use technical analysis to identify long-term trends and suitable entry points.
5. What is the difference between technical and fundamental analysis?
Technical analysis focuses on price movement and charts, while fundamental analysis studies company financial performance and economic data.
6. How long does it take to learn technical analysis properly?
Basic concepts can be learned within weeks, but consistent application and deeper understanding usually take months of practice.
7. Is price action better than indicators in trading?
Price action focuses directly on market movement, while indicators support analysis. Many traders combine both for better context.
8. Can technical analysis be used in volatile markets?
Yes, it is often used to manage risk and understand momentum during high volatility.
9. Do professional traders use technical analysis?
Yes, many institutional and retail traders use technical analysis as part of their market evaluation process.
10. Is technical analysis applicable outside the stock market?Yes, it is widely used in forex, commodities, indices, and cryptocurrency markets.