Technical Analysis of Stocks: Smart Trading Starts with Chart Reading
What Is Technical Analysis in the Stock Market?
Technical analysis is a practical way of looking at price movement, chart patterns, volume, trends and market behaviour before deciding to trade. It helps traders to understand what is happening on the chart rather than relying on news, tips or emotional decisions. This method can add some structure and simplicity to trading for the active stock market trader.
When a stock goes up, down or stays in a range, there are usually some signs left on the chart. These signs can come in the form of support levels, resistance areas, trend lines, candlestick patterns or volume activity. Once a trader learns to read these signals, they can understand market behaviour in a more practical manner.
Why Do Traders Use Technical Analysis of Stocks?
Technical analysis of stocks is used by traders because the timing is very important in trading. A stock may be fundamentally sound, but if the current chart pattern is weak, it may not be the right time to get in. Similarly, a stock can show short-term strength when there is buying activity and improving volume. This is where reading the graph can help.
The goal of technical analysis is not to perfectly predict the market. No one can do that all the time." The real goal is to understand probability, risk and price structure. By looking at entry levels, stop-loss zones, potential targets and market conditions before they enter a trade, traders can make disciplined trading decisions.
How Does Stock Market Technical Analysis Work?
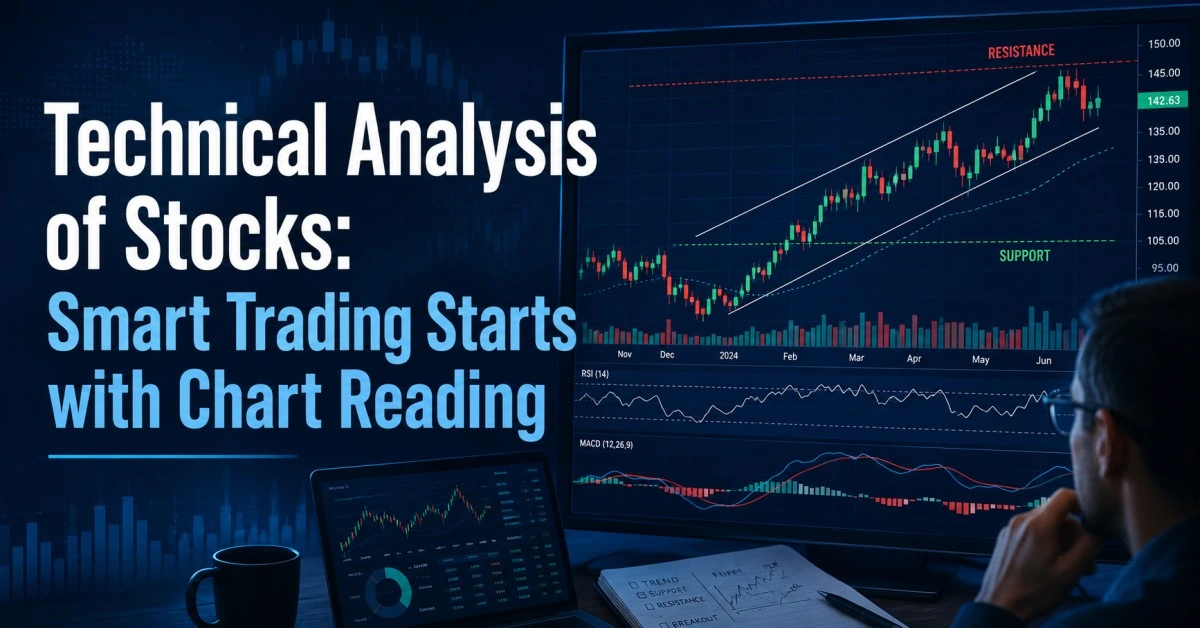
Technical analysis of the stock market relies on how price behaves at various levels. If the stock repeatedly finds support near the same price it suggests that buyers may be active in that zone. If the stock keeps getting rejected around a higher price that can serve as resistance. These areas help traders get a sense of where the stock may pause, reverse or continue its move.
Volume is also a big part of analysis. A breakout on strong volume can show better participation A breakout on weak volume can fail fast That is why traders do not study price alone. The best view comes from studying price action, volume, trend and market condition together.
Important Elements of Trading Analysis
A good trading analysis usually requires more than one signal. The market moves very fast so depending on a single indicator or a single candle is risky. Traders tend to look at the whole chart before they decide what they think.
| Analysis Factor | What It Shows | Why It Matters |
| Trend | Shows the direction of the stock | Helps understand the main price movement |
| Support | Shows a possible buying zone | Helps identify important price areas |
| Resistance | Shows a possible selling zone | Helps track breakout or rejection levels |
| Volume | Shows participation in the move | Helps confirm whether the move has strength |
| RSI | Shows momentum condition | Helps read strong or weak price movement |
| Moving Average | Shows average price direction | Helps understand trend strength |
Which Indicators Are Useful for Traders?
Indicators can be used to help you make trading decisions but should not be blindly followed. A common beginner mistake is to add too many indicators to their charts. It's confusing and makes it hard to make a decision. For practical analysis purposes, a simple chart with trendlines, support, resistance, moving averages, RSI and volume will do.
The moving averages are assisting traders to identify the direction of the trend. RSI is an indicator of whether momentum is strong, weak, overbought or oversold. Volume confirms whether the market is dominated by buyers or sellers. Candlestick patterns can also give short-term signals, but should always be confirmed with the overall trend and market context.
How Can Technical Analysis Improve Entry and Exit Planning?
Technical analysis can help traders to plan their entries and exits better. Before making a trade the trader can see if the stock is near support, breaking resistance, moving with volume or showing strength in the trend. So it decreases the chances of taking random trades.
Exit planning matters just as much. Many traders only think about the entry and not what they will do if the trade goes wrong. A clear stop loss helps to protect your capital and control emotional decisions. Finding opportunities in trading is as important as managing losses.
What Mistakes Do Beginners Make in Technical Trading?
Beginner players often want a perfect strategy or a guaranteed indicator. This is a typical mistake, considering the stock market does not work with perfect certainty. There is risk in every trade and even a good looking set up could fail due to sudden news, weak market sentiment or unexpected selling pressure.
Another common pitfall is overtrading. Too many traders make too many trades with no plan and they lose discipline. Some traders also increase their position size after losing which can be risky. A better way is to make fewer trades, but well thought out, follow risk limits and review mistakes regularly.
Is Technical Analysis Enough for Stock Trading?
Technical analysis is useful but should not be the only thing that a trader depends on. Traders also need to be aware of the broad market trends, sector performance, index movement, global cues and important news events. Even a great chart setup can fail if the overall market is weak or if there is a sudden increase in volatility.
It is best to keep the process simple and practical. Traders can analyze the chart, evaluate the market environment, risk-control before entering any position. A simple strategy applied with discipline is often better than a complex system applied without control.
Why Risk Management Matters in Technical Analysis
Risk management is one of the most important parts of analysis in trading. Nothing is ever guaranteed, even if a chart setup looks good. This is why traders need to know how much risk they are willing to take prior to entering a trade. Position sizing, stop-loss placement and risk reward planning, help traders stay controlled during market movement.
A disciplined trader doesn’t think of technical analysis as a shortcut. It is just a tool to understand the behaviour of prices. The real value is in a combination of chart reading, patience, risk control and emotional balance.
What Should Traders Check Before Exploring Any Structured Trading Setup?
Once experienced in the market, traders might consider structured trading environments, trading desks or professional trading platforms. Traders need to know the rules, eligibility, risk conditions, costs, platform structure and restrictions before they consider such a setup. They must not rely on any claim that implies guaranteed income, assured funding, fixed returns, job placement, or risk-free trading.
BearStreet and any other structured trading platforms should be evaluated only from the point of view of information and suitability. Traders must read all terms carefully and understand that participation, access or continuation may be subject to internal criteria, rules, risk limits and performance conditions.
Final View
Technical analysis helps traders understand price behaviour, trend direction, resistance, support, momentum and risk levels . It does not promise a profit, but can improve decision making if used with discipline. A good trader does not rely on one signale. The trader spends time studying the entire set-up, manages risk and avoids emotional decisions.
This article is for informational and educational purposes only. It does not provide investment advice, stock recommendation, job assurance, course guarantee, income guarantee, funding approval, placement promise or profit promise. Trading involves risk and every trader should make decisions after proper research, risk assessment and personal suitability checks.
FAQs on Technical Analysis of Stocks
1. What is technical analysis of stocks?
Technical analysis of stocks is the study of price movement, chart patterns, volume, support, resistance and trends in the market. It allows traders to see how a stock is performing on the chart before making any trading decisions.
2. Is technical analysis useful for beginners?
Yes, technical analysis can be helpful for beginners if it is learned step-by-step. Beginners should first learn basic concepts like trend, support, resistance, volume and risk management rather than using too many indicators at once.
3. Can technical analysis guarantee profit in trading?
No, no technical analysis can assure profit. It assists traders to study the market behaviour and plan trades in a more structured way. Every trade is risky. So proper stop loss, position sizing and risk control is important.
4. Which indicators are commonly used in stock market technical analysis?
Stock market technical analysis typically uses indicators like moving averages, RSI, volume, trendlines and candlestick patterns. Such tools help traders to identify the direction of the trend, momentum and possible zones of price reaction.
5. What should traders check before using any trading setup or platform?
Before using any trading setup or platform, traders should review the rules, risk conditions, platform structure, costs, eligibility criteria and restrictions. They should not make any claim of guaranteed income, assured funding, fixed profit or risk free trading.