Technical Analysis Trading: How Chart Patterns and the Right Tools Turn Market Noise Into a Tradable Edge
Every trader eventually hits the same wall. The fundamentals look fine, the news is bullish, and the position still loses money — because it was entered at the wrong price, at the wrong time, against the wrong trend. That gap is exactly what technical analysis trading exists to close. Instead of asking whether an asset deserves to go up over the next five years, it asks a narrower, more useful question: based on how price and volume have actually behaved, what's most likely to happen next, and where is the risk worth taking?
That question matters more now than it did a decade ago, simply because of how much noise surrounds every market session. Social media commentary and an endless stream of opinions move faster than most traders can process, and without a structured way to filter it out, decisions start being driven by emotion rather than evidence. Technical analysis offers that structure. It doesn't promise certainty — and any source that frames it that way is overselling the method.
What Is Technical Analysis in Trading and Why Does It Still Work?
Technical analysis is the study of historical price action, volume, and chart structure to forecast probable future movement. It rests on three assumptions that have held up across decades of market cycles: price reflects all available information, price moves in identifiable trends rather than pure randomness, and history tends to repeat because human behavior under fear and greed doesn't change much. None of this guarantees an outcome — what it does is replace guesswork with a repeatable process, which is why trading analysis built on charts has survived every new asset class, from equities and commodities to forex and crypto. A trader who understands support, resistance, and trend structure on a stock chart can apply the same logic to a currency pair or a Nifty future with very little adjustment, because the underlying behavior of buyers and sellers doesn't change with the ticker symbol.
The thing that actually separates traders who survive from traders who blow up an account is rarely a secret indicator. It's the discipline of waiting for the chart to confirm a thesis before risking capital, and the willingness to exit when the chart says that thesis is wrong. That discipline rests on a small set of recurring elements: trend direction, support and resistance zones, volume confirmation, and pattern recognition. Choppy, low-volume sessions tend to generate far more false signals than trending, liquid ones, which is why experienced traders watch the overall market environment as closely as any individual setup.
Which Chart Patterns Actually Matter for Trading Decisions?
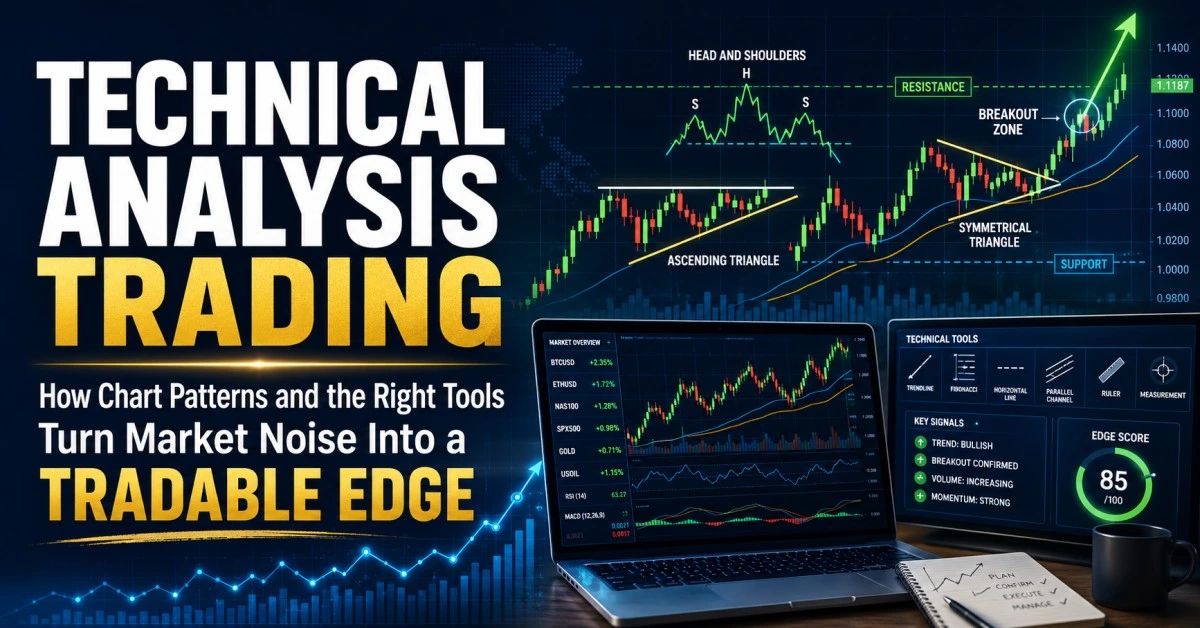
Chart patterns are visual footprints left behind by the ongoing tug-of-war between buyers and sellers, and a handful of them show up often enough to actually be useful rather than decorative. Head and shoulders formations, double tops and bottoms, triangles, flags, and wedges each describe a different stage of that fight: accumulation, exhaustion, consolidation, or breakout. Take a double bottom, for example. Sellers push price down, buyers defend it, sellers try again and fail a second time — and that failure is itself information. It often triggers the next leg higher as short sellers cover and new buyers step in.
The mistake most newer traders make with chart patterns is treating them as guarantees instead of probabilities. A pattern only earns trust once it's confirmed by something else, usually volume or a clean break of a key level. The table below covers the patterns that show up most often in real trading analysis, what each one tends to signal, and the confirmation worth waiting for before acting on it.
| Chart Pattern | What It Typically Signals | Best Confirmation to Wait For |
| Head and Shoulders | Trend reversal from bullish to bearish | Break below neckline with rising volume |
| Double Bottom / Double Top | Exhaustion of the prevailing trend | Decisive close beyond the pattern's resistance/support |
| Ascending / Descending Triangle | Continuation in the direction of the breakout | Breakout candle closing outside the triangle with volume spike |
| Bull / Bear Flag | Short pause within a strong existing trend | Resumption of the prior trend direction on increased volume |
| Cup and Handle | Bullish continuation after consolidation | Breakout above the handle's resistance |
Used in isolation, any one of these patterns will occasionally fail, and that is normal rather than a flaw in the method. Used alongside trend context and volume, the win rate and risk-to-reward profile both improve. Context matters as much as the pattern itself: a head and shoulders pattern forming after a long, exhausted uptrend carries far more weight than the same shape appearing in a sideways, low-volume chop, because the first scenario reflects a genuine shift in supply and demand while the second may simply be noise.
Reading a pattern correctly is only half the job, though. The other half is having a platform that lets you act on it without losing the edge to a slow fill or a shaky data feed. See how BearStreet's trading infrastructure supports pattern-based strategies →
What Are the Most Reliable Technical Analysis Tools for Traders?
The tools available to traders today are dramatically more capable than what was available even ten years ago, and that abundance is itself a problem if it is not managed well. Moving averages remain one of the most dependable technical analysis tools precisely because of their simplicity; a 50-day and 200-day crossover still gives a clean, low-noise read on whether a longer-term trend is intact. Momentum oscillators like RSI and MACD add a second dimension by measuring the speed and strength of a move, helping traders spot when a trend is losing steam before price action makes it obvious. Volume-based tools answer a question price alone cannot: whether a move is driven by genuine participation or by thin trades that could reverse just as quickly.
The honest insight here is that more indicators rarely produce better decisions. Stacking five momentum oscillators on one chart usually just means five versions of the same signal, creating a false sense of confirmation rather than real confirmation. A more effective approach pairs one trend tool, one momentum tool, and one volume tool, then leans on price structure and chart patterns for the final call. Platform quality matters as much as analytical skill here too: a perfectly sound thesis can still lose to slow execution or a feed that lags during high volatility, exactly when a setup needs to be acted on cleanly.
There is also a practical difference between tools that describe the past and tools that anticipate the next move. A moving average is always a few periods behind current price, useful for confirming an established trend but weak as an early warning of reversal. RSI is somewhat more forward-looking, but it too can stay overbought or oversold for extended periods during a strong trend, which is why treating that as an automatic sell signal is a common and costly misreading.
How Should a Beginner Actually Start Doing Technical Analysis?
Most beginners start in the wrong place: hunting for the one indicator combination that promises consistent wins. The more durable starting point is learning to read a clean candlestick chart without any indicators at all, identifying where price has previously reversed or paused, and only then adding tools to confirm what the chart structure already suggests. Paper trading a defined strategy across twenty to thirty setups reveals far more about a method's real edge than reading alone, and it exposes the psychological side of trading early, in a low-stakes setting, rather than during a live trade where fear distorts judgment.
Risk management deserves equal weight, and arguably more. A trader who correctly identifies a chart pattern but risks too much capital can still be wiped out by an unexpected gap or a thin stop-loss fill. Defining position size and maximum loss before entry, not after, is what allows a trader to be wrong on individual trades and still be profitable over a series of them. Even technically skilled traders lose money for reasons unrelated to chart-reading skill: forcing a trade onto a chart that does not offer a clean setup out of boredom, ignoring broader market context in favor of an isolated chart, or moving a stop-loss further away once a trade moves against the plan, hoping price comes back. That last habit, more than any analytical error, is what turns small, manageable losses into account-damaging ones, which is exactly why the stop-loss decided before entry should be honored consistently rather than renegotiated mid-trade.
Why Execution Infrastructure Matters as Much as the Chart Itself
A technically sound trade idea is only as good as the system used to act on it. Slippage during a fast breakout, a delayed data feed during a key level test, or a platform that cannot handle order flow during a volatile session can turn a well-read chart pattern into a losing trade through no fault of the analysis itself. This is precisely the gap BearStreet is built to close. BearStreet pairs structured trading infrastructure with disciplined risk frameworks and access to Indian, US, and European markets, giving traders an environment where execution stability matches the quality of their technical analysis rather than undermining it.
It is worth being direct about what this means. BearStreet provides trading infrastructure, market access, and a structured framework for traders to apply their own analysis and risk management, not a guaranteed income or a promise of profit. Trading carries genuine financial risk regardless of how disciplined the analysis behind it is. What a well-built platform can reasonably offer is consistency: reliable execution, transparent risk parameters, and an environment that does not add unnecessary friction to a trader's own decision-making process. If you want to see how that infrastructure actually holds up, explore BearStreet's market access and execution setup here and decide for yourself whether it fits how you trade.