Technical Analysis of Stock Trends: A Practical View for Serious Traders
Why Traders Pay Attention to Stock Trend Analysis
Stock prices fluctuate according to demand and supply, market sentiment, news, performance of sectors, global cues and trader behaviour. For many traders, it is not just about finding a moving stock, but understanding whether that movement has strength, structure and risk clarity. This is where technical analysis of stock trends comes in handy.
Technical analysis involves studying price movement through charts, volume, support, resistance and trend direction. It doesn’t guarantee what the market will do next, but it does help traders make more educated observations instead of relying on guesswork or emotion. A trader that studies charts carefully can understand if a stock is trending upwards, falling under pressure or moving sideways within a range.
Stock trading platforms are also used by traders in the current markets to access the charts, indicators, alerts, option chain data and order execution tools. A platform can assist on analysis but ultimately the final decision is up to the trader’s understanding, discipline and risk management.
What Is Technical Analysis in Stock Trading?
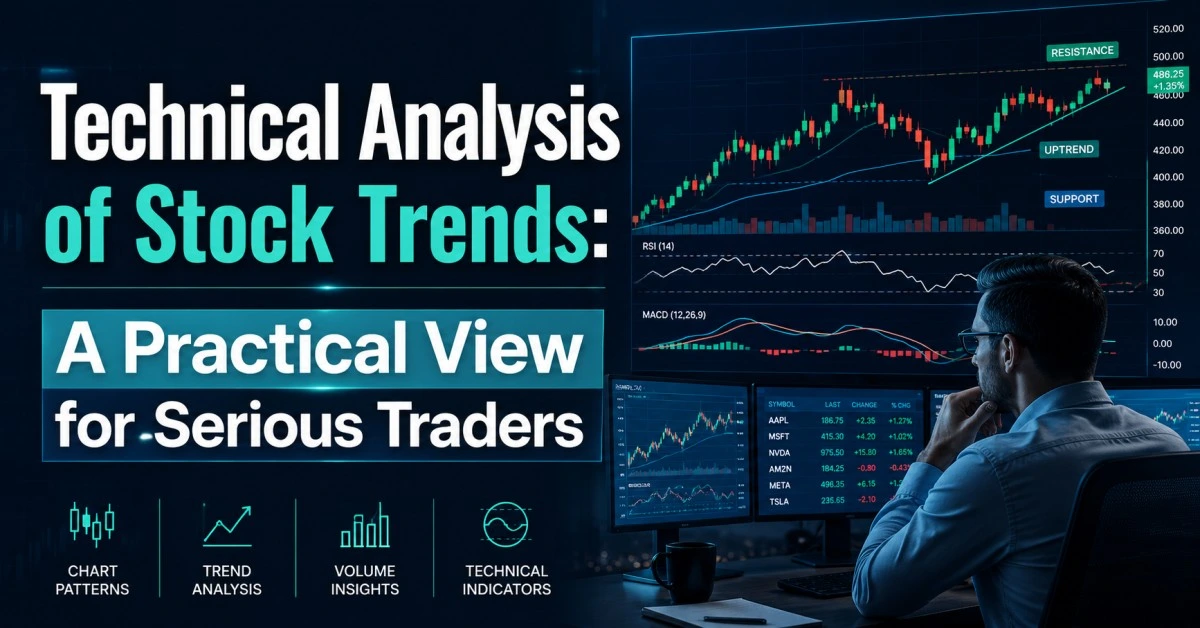
Technical analysis is the study of price charts, volume and market patterns in order to understand potential price action. Technical analysis is what price is showing on the chart, unlike fundamental analysis that looks at company financials, business growth and valuation.
When traders analyze a stock trend, they typically look to see if the price is creating higher highs and higher lows, lower highs and lower lows, or is stuck in a range. An upward trend could indicate buyer strength, while a downward trend could indicate selling pressure. A sideways trend could mean the market is waiting for a clear direction.
This is helpful because prices often reflect the collective behaviour of the market. Price increases on strong volume may indicate active participation. Price moves higher but volume is weak. This move may need more confirmation. This is why technical analysis trading is not about just looking at one indicator. It's about reading the whole chart structure.
How Stock Market Graph Analysis Helps in Better Decision-Making
Stock market graph analysis gives the traders an idea about the price action over a period of time. A chart can display short term movement, daily trend, weekly structure or long term price direction. The length of time depends on the trader’s style. Intraday traders may use smaller charts, swing traders may use daily or weekly charts.
Candlestick charts are popular because they display open, high, low and closing prices in a simple format. A strong green candle shows buying interest, a strong red candle shows selling pressure. But a single candle should not be taken as a complete signal. Traders generally look at candles together with support, resistance, volume and the overall market direction.
Support is a price area where buyers might step in. Resistance is a price area where sellers may show up. A breakout is when price breaks above resistance with strong volume. If it breaks below support, price may demonstrate weakness. However, false breakouts are frequent, so every trade must be properly risk-planned.
Why Stock Trading Platforms Matter for Chart-Based Traders
Stock trading platforms matter because traders need reliable charts, smooth data, alerts, watchlists and execution tools. A good platform makes chart reading easier and it helps traders organize tracking of price movement.
If you’re a technical trader, platform quality matters a lot, because bad charting tools or data delays can impact your trading decisions. Traders will look for clean chart layouts, multiple timeframes, drawing tools, volume data and helpful indicators. Options traders may also need open interest , implied volatility , strike price movement and expiry data .
But success is not a shortcut through a trading platform. It’s just a tool. The real value is in how the trader uses the platform, with discipline, patience and risk control.
| Trading Need | Why It Matters | What Traders Should Check |
| Charting Tools | Helps traders study trend direction and price structure | Multiple timeframes, drawing tools and clean charts |
| Market Data | Supports better stock market graph analysis | Live prices, volume and historical chart data |
| Execution Quality | Important for active market participation | Platform stability, order speed and slippage awareness |
| Option Chain Data | Useful for option trading technical analysis | Open interest, implied volatility and expiry details |
| Risk Controls | Helps traders manage losses | Stop-loss, alerts, margin visibility and position tracking |
Common Indicators Used by Technical Traders
Traders apply technical indicators to analyze trend strength, momentum and volatility. Moving average is commonly used to see if price is trading above or below its average level. Price may show strength if it remains above an important moving average. If price remains below it, weakness may be seen.
The Relative Strength Index (RSI) is used to measure momentum. A high RSI can indicate strong buying momentum, but it can also indicate overbought conditions. A low RSI can be a sign of weakness, but it can also be a sign of oversold conditions. This is why you should use RSI in conjunction with chart structure and not use it by itself.
One of the most useful parts of technical analysis trading is volume. A breakout with a lot of volume may have better participation, while a breakout with little volume may fail fast. Traders can also use VWAP, MACD, Bollinger Bands and trendlines to analyse price behaviour. The key is to keep the chart clean and not to use too many indicators at the same time.
What Is Option Trading Technical Analysis?
Technical analysis of option trading involves looking at charts, trend direction, support, resistance, option chain data, open interest and volatility before deciding on an options-related decision. Options are a bit more complex than stocks as their prices are influenced by the underlying asset, time decay, implied volatility and expiry.
For example, if a trader expects an index or stock to move higher, buying a call option may seem straightforward. But if the premium is high, volatility is high or expiry is near, the trade may not work out as expected. In weak market you also need timing, risk control and knowledge of premium movement to buy a put option.
Most options traders will begin by studying the chart of the underlying stock or index. Then they look at option chain data to see where open interest is building. These levels are not static signals and traders should be checking them regularly as they can change quickly.
How Technical Analysis Helps Traders Understand Trends
Finding trends is one of the main reasons traders use technical analysis. A trader wants to know if buyers are in charge, if sellers are active or if the market is moving without a clear direction. This understanding keeps traders from taking a trade simply because the price action is moving fast.
If the stock is making higher highs and higher lows, the trend could be up. If it is making lower highs and lower lows, the trend may be breaking down. A stock may be in a range if it moves up and down between support and resistance. The approach to trading may vary from case to case.
Stock movement can also be dependent on overall market direction, strength of the sector and global cues. Even a fundamentally strong stock can feel pressure in a weak market. If the sector gets suddenly better, a weak stock can bounce, too. This is why stock trend analysis works best when the trader looks at the full market context.
Common Mistakes Traders Make While Reading Charts
A common mistake is to rely on indicators exclusively and ignore price action. Indicators can help, but price and volume are the basics of chart reading. If the chart is packed up with too many tools then the trader may get confused with mixed signals.
A further common mistake is trading without stop loss. Technical analysis can help identify potential setups, but it cannot take away market risk. Every trade should have a clear invalidation point. If the setup fails the trader should not wait emotionally and respect the plan.
Many traders also change their method too much. One day they follow moving averages, one day they follow RSI and one day they follow random breakout ideas. This makes it hard to review performance. A more professional approach would be to have a clear process, keep a trading journal and review decisions regularly.
Why Risk Management Is More Important Than Prediction
No chart pattern, indicator or platform can tell you for certain what the market will do. That’s why risk management is more important than prediction. Even when the trader correctly identifies the trend, he can still lose money if he enters poorly, uses too large a position size or ignores his stop-loss.
Traders should know the purpose of the trade, entry level, risk level, target zone and position size before entering a trade. This is very important in stocks and options. In options, risk management is even more crucial because premiums change rapidly as a result of time decay and volatility.
Risk management helps traders stay cool. Without risk control a little mistake can result in a big loss. A plan allows traders to accept losses as part of being in the market and focus on improving their process.
Informational View on BearStreet for Structured Trading Access
If you already know how to read charts, know market risk, tech analysis and trading discipline, you can explore BearStreet.in for structured trading access and eligibility conditions for traders. BearStreet is just referenced here as a source of information for the traders that want to understand rule based trading environments.
BearStreet makes no guarantee of profit, fixed income, job placement, course outcome, guaranteed funding, trading success or any guaranteed result. Trading is subject to market risk and access is subject to eligibility, internal criteria, platform rules, risk controls and trader suitability.
This CTA is for exploration and information only. Readers should read all rules, conditions, risks and suitability factors before making any trading related decision.
How to Build a Better Technical Analysis Process
A better process for technical analysis starts with market context. Traders should look at the broader index, sector movement and overall sentiment before looking at one stock. If the market is weak, aggressive buying may be riskier. When the market is strong, breakout setups get better support.
Next, traders should study the stock trend. They can tell the direction of the price whether it is going up, down or sideways. Mark important support and resistance levels clearly as these zones are helpful in planning entries, exits and stop-loss levels.
Volume should be checked carefully too. Strong volume move could have a better participation. A low volume price move may need more confirmation. Another thing is avoid late entries after a stock has moved too far already, as it may not be as attractive for risk-reward.
A trading journal can also assist in the process. Reviewing past trades provides traders the opportunity to spot repeated mistakes, strong setups and emotional patterns. This can help to develop discipline and decision making in the long run.
Final View on Technical Analysis of Stock Trends
Technical analysis of stock trends is a practical way of understanding price behaviour, market psychology and chart structure. It helps traders to study trends, support, resistance, volume and possible entry-exit zones more clearly.
Stock market graph analysis is more useful when it is integrated with reliable stock trading platforms, clean charting tools and strong risk management. Research option chain data, implied volatility, expiry impact and premium behaviour for options traders before making decisions.
Technical analysis trading should not be seen as a quick route to guaranteed results. It is just a structured way to reduce confusion and improve decision making. Those who see it as a process, not a tool for prediction, can develop better discipline over time.
This article is for informational purposes. It does not offer investment advice, trading advice, financial advice, job assurance, course promotion, guaranteed funding, fixed income, profit promise or assured trading outcome. Stock and options trading carries market risk and readers should do their own due diligence on the rules of the platforms, risk controls and suitability to them before making any trading decisions.
FAQs on Technical Analysis of Stock Trends
What is technical analysis of stock trends?
Stock trend technical analysis is studying charts, price action, volume, support and resistance to understand market direction.
Why is technical analysis trading useful?
Technical analysis trading helps traders to read price behaviour, identify possible set ups and manage risk more structurally .
What is stock market graph analysis?
The analysis of a stock market graph is the reading of charts to identify trends, breakouts, breakdowns and price zones.
Which indicators are used in technical analysis?
Common indicators are: Moving averages, RSI, MACD, VWAP, Bollinger Bands and volume indicators.
Are stock trading platforms important?
Common indicators are: Moving averages, RSI, MACD, VWAP, Bollinger Bands and volume indicators.
What is option trading technical analysis?
Technical analysis of option trading involves analyzing charts, open interest, volatility, expiry and price movement before making any option related decisions.
Can technical analysis guarantee profit?
No, technical analysis cannot guarantee profit. Trading is risky and any setup can fail.
How do traders identify stock trends?
Traders look for trends and they do this by watching for higher highs, higher lows, lower highs, lower lows and sideways price ranges.
What mistakes should traders avoid?
Don’t over-trade, don’t use too many indicators, don’t ignore volume and don’t trade without a stop-loss.
Is BearStreet suitable for every trader?
No, BearStreet is only for qualified traders who know the risk of the market and know the rules and trading discipline.