Technical Analysis, Chart Patterns and Trading Analysis for Better Entry and Exit Decisions
What Is Technical Analysis in Trading?
Technical analysis is a market analysis based on price movement, volume, trends and chart behaviour. Traders use charts to see live what buyers and sellers are doing, rather than depending on news, tips or opinions. This allows them to make more planned decisions rather than trading emotionally.
Simply put, technical analysis helps traders answer critical questions such as whether the market is going up, down or sideways. It also helps them identify key price levels where the market may react. These levels can be support, resistance, break-out levels or reversal levels.
Technical analysis is no guarantee that a trade will work. No method can forecast the market perfectly. Its real purpose is to help traders to be more prepared, to manage risk and to avoid making random decisions.
Why Do Traders Use Chart Patterns?
The chart pattern is the formation of price action on a trading chart. These patterns offer traders a visual way of understanding market behaviour. When buyers and sellers repeatedly act in similar ways, certain patterns begin to emerge on the chart.
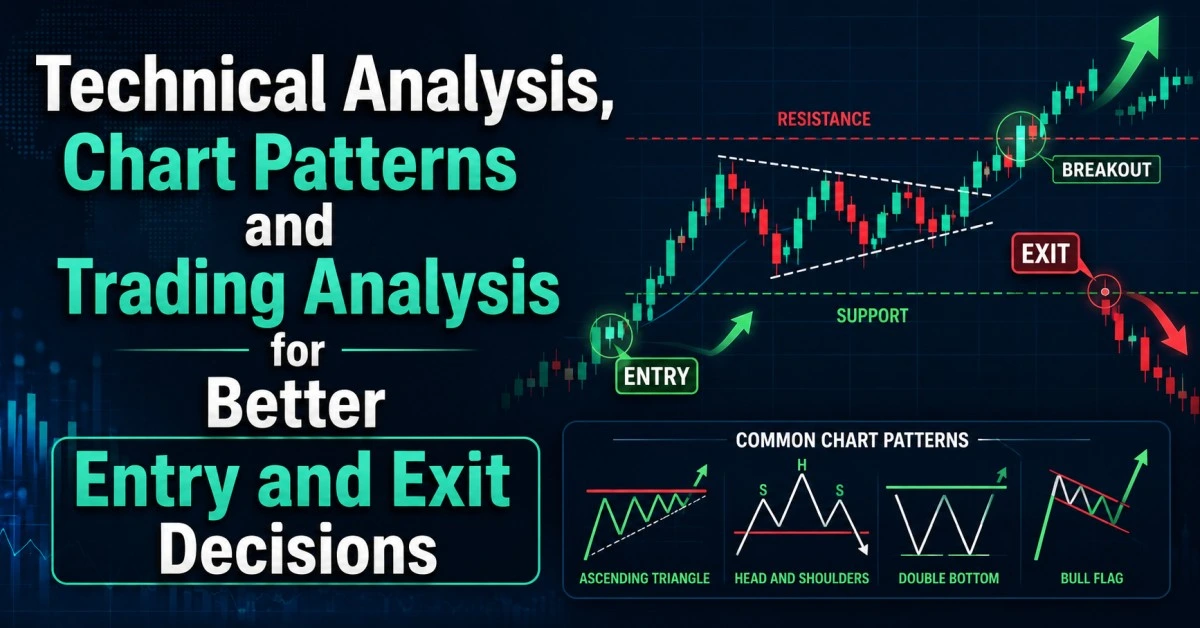
For example, if price is constantly taking support from the same area, it means that buyers might be active there. If price keeps getting rejected around the same price level time and time again, that area could be acting as resistance. Traders look for continuation of the move when price breaks out of a range on strong volume.
And this is how chart patterns come in handy in trading analysis. They assist traders to read the market in a more structured way. However, traders should not view any pattern as a sure fire signal. Patterns are more useful when confirmed by trend, volume, price action and proper risk planning.
How Technical Analysis Helps in Real Trading
Many beginners enter trades because they see a stock moving fast or because someone gives them a tip. This can be risky because the entry may be late, the stop loss may be unclear and the trader may not know when to exit.
Trading technical analysis helps solve this problem by giving traders a process. Before taking a trade, a trader can check the trend, mark support and resistance, look for chart patterns, confirm volume and decide where the trade idea becomes invalid.
This makes trading more disciplined. Instead of asking only, “Will this stock go up?” a trader starts asking better questions such as, “Where is the risk?” “Is the setup clear?” “Is the volume supporting the move?” and “What is my exit plan if the trade does not work?”
Common Trading Chart Patterns Traders Should Know
Trading chart patterns can show continuation, reversal or breakout behaviour. A continuation pattern means the current trend may continue after a pause. A reversal pattern means the current trend may be weakening. A breakout pattern means price is moving out of an important range or level.
| Chart Pattern | What It Usually Means | What Traders Watch | Simple Risk Insight |
| Head and Shoulders | Possible weakness after an uptrend | Breakdown below neckline | Price may reverse if it quickly moves back above neckline |
| Inverse Head and Shoulders | Possible recovery after a downtrend | Breakout above neckline | Confirmation is important before entry |
| Double Top | Price rejected twice from resistance | Breakdown below support | Stronger when selling volume increases |
| Double Bottom | Price defended support twice | Breakout above resistance | Weak breakout can trap early buyers |
| Ascending Triangle | Buyers are building pressure | Breakout above resistance | Volume should support the breakout |
| Descending Triangle | Sellers are building pressure | Breakdown below support | Stop-loss planning is important |
| Flag Pattern | Short pause after a strong move | Continuation in trend direction | Late entry may reduce risk-reward |
The goal is not to memorize every pattern name. The real skill is understanding what the pattern is showing about demand, supply and market behaviour.
Why Support and Resistance Are Important
Support and resistance are two of the most important concepts in technical analysis. Buyers can become active support. Resistance is a place where sellers might get active. These levels are useful as price will often react near them.
For example, if a stock bounces off ₹500 a few times, traders might start watching that as support. If the same stock failed to cross ₹550 that level may be a resistance. Traders can watch out for a possible breakout if the price finally crosses above ₹550 with strong volume.
Treat support and resistance as zones rather than specific lines. Price can pierce a level a bit to the upside or downside before a clear reaction takes place. That’s why traders should not take decisions based on just one candle/line on the chart.
How Volume Confirms Chart Patterns
Volume tells you how much trading activity there is. It is an important part of the trading analysis because it helps the traders to know whether a move has real participation in the price.
If the price moves above resistance but the volume is low, the breakout may be weak. If the price breakout comes with strong volume, the move could have better participation. Likewise if price breaks support with high volume this could mean stronger selling pressure.
Volume does not guarantee success, but it does bring confirmation. A chart pattern with strong volume is typically more important than the same pattern with weak participation.
Breakouts and False Breakouts
A breakout occurs when price moves above a resistance level or below a support level. Many traders love breakouts as this could lead to a strong move. But not all breakouts are successful. Sometimes price breaks a level and attracts traders and then quickly reverses. This is called a false breakout .
A lot of traders enter too early without confirmation, and this is why false breakouts are common. Many traders wait for volume confirmation, candle close, retest of the breakout level or alignment with the larger trend to reduce this risk .
It doesn’t remove risk completely, but it can help traders avoid bad setups. In trading, it is just as important to avoid bad trades as it is to find good trades.
Role of Indicators in Technical Analysis
Indicators can be useful to traders to understand trend, momentum and volatility, but they should not replace price action. Moving averages can be used to determine trend direction. RSI can help you get a feel for momentum. VWAP can be useful for traders intraday. Volume indicators can be used to confirm participation.
The problem begins when traders add too many indicators. A chart with multiple indicators can be confusing. A simple chart with price action, support and resistance, volume and a couple of useful indicators is often easier to read.
Good technical analysis for trading is not complicating the chart. It’s about making the decision-making process clear.
Why Risk Management Matters More Than Accuracy
No chart pattern is perfect. News, sudden volatility, global market movement or institutional activity can all send a clean setup awry. This is the reason why managing risk is more important than being right on every trade.
Traders should know where to exit before getting into a trade if the trade goes wrong. They should also know the amount of capital they are putting at risk and whether the risk-reward is reasonable.
A trader that protects capital can continue to learn and improve. The best chart patterns won’t help a trader who ignores risk and quickly loses confidence. Technical analysis only works when used in conjunction with discipline and risk control.
How Serious Traders Build a Better Trading Process
Serious traders don't trade every chart they see. They wait for the right set-ups. They look at the higher timeframe to understand the main trend and then use the lower timeframe to plan better entries. They identify key levels, check volume, wait for confirmation, and set risk before entering.
They also review their trades; This helps them see if they acted emotionally or if they stuck to their plan. Over the long term this process leads to better decisions.
Trading analysis is not just about finding buy or sell signals. It's about building a process that can be repeated to keep traders disciplined in all types of market conditions.
BearStreet CTA for Serious Traders
If you are serious about improving your trading process and want to explore a more structured trading environment, BearStreet provides a prop trading desk setup for eligible traders. It is designed for traders who understand the importance of discipline, risk control, execution quality and consistent market analysis.
Check your eligibility at BearStreet.in and see whether BearStreet’s structured trading setup matches your trading approach. This is not a job offer, course promise, income guarantee or profit assurance. Access depends on eligibility, internal criteria, risk rules, trader suitability and performance-based evaluation. Trading involves market risk.
Final Thoughts
Price movement, market structure, trend, support, resistance and volume are understood by traders through technical analysis. Chart patterns help with that process by showing how buyers and sellers may be reacting on the chart.
But trading chart patterns should never be used blindly. A pattern is only useful when it is backed by trend, volume , price action and risk management . The goal is not to predict every move but to make better, more planned trading decisions.
The best way for traders is simple. Study the chart, respect risk, avoid emotional entries and have a clear process. When technical analysis and discipline come together, trading is more structured and less random.
Frequently Asked Questions
What is technical analysis in trading?
Technical analysis is the study of price, volume and chart behaviour to understand market trends, support, resistance and possible trade setups.
Why are chart patterns important?
Chart patterns help traders read buyer and seller behaviour. They can show possible breakout, reversal or trend continuation areas.
Are trading chart patterns always accurate?
Are chart patterns always right ? No . Traders must check it with trend, volume, price action and proper risk management.
What is trading analysis?
Trading analysis consists of technical analysis, risk management, entry exit planning, position sizing and trader psychology.
How can beginners start technical analysis?
Beginners should learn about trend, support, resistance, volume, candlesticks and simple chart patterns before using the advanced indicators.